Friday 31 January 2014

Snow and Ice in the Southeastern United States

A large winter storm swept through the southeastern United States in January 2014, dropping snow and ice on an area unaccustomed to dealing with winter weather.

While clouds still covered most of the area affected by the storm when the Terra satellite passed over on January 29, 2014, the Moderate Resolution Imaging Spectroradiometer (MODIS) on board captured this view of snow on the ground in parts of northern Georgia, northern South Carolina, eastern Tennessee, and western North Carolina. According to the National Weather Service, the storm dropped up to 9 inches (23 centimeters) of snow in parts of North Carolina, 4 inches (10 centimeters) in parts of South Carolina and Georgia, and 2 inches (5 centimeters) in parts of Tennessee. Atlanta received 2.6 inches (6.6 centimeters) of snow. Many areas also received significant amounts of freezing rain and sleet.

The winter weather and the limited supply of snow-clearing equipment led to extreme travel woes throughout the region. In Atlanta, commuters faced gridlock on Tuesday afternoon as schools, businesses, and government offices all closed at approximately the same time. In many areas, roads that are normally packed with travelers ground to a complete standstill as accidents piled up. Frustrated by the gridlock, thousands of Atlantans abandoned their cars, which led to even more extreme congestion. Some children were forced to stay at school all night because the roads were impassable.

In the aftermath of the storm, there has been much discussion about whether meteorologists provided officials with an accurate forecast and enough warning. In a blog post published after the storm, Marshall Shepherd, president of the American Meteorological Society, argued they did. “The buses had a tough time getting kids home, but meteorologists should not be thrown under the bus,” he wrote, noting that the National Weather Service had started issuing snow warnings and watches as early 4:55 a.m. on Monday.
  1. References

  2. Atlanta Journal-Constitution (2014, January 30) Interstate-clearing focus turns over 2,000 abandoned cars. Accessed January 30, 2014.
  3. National Center for Environmental Prediction (2014, January 29) Storm Summary Message. Accessed January 30, 2014.
  4. Shepherd, M. (2014, January 29) An Open Thank You to Meteorologists in Atlanta. Accessed January 30, 2014.
  5. Washington Post (2010, December 28) Are meteorologists to blame for snow disasters in Atlanta and Birmingham? Accessed Accessed January 30, 2014.
  6. Weather Underground (2014, January 29) SnowedOutAtlanta: Extreme Travel Chaos in the Deep South. Accessed January 30, 2014.
  7. NASA Earth Observatory image by Jesse Allen and Robert Simmon, using data from the Land Atmosphere Near real-time Capability for EOS (LANCE). Caption by Adam Voiland.

    Instrument: 
    Terra - MODIS - NASA

Agriculture Fires in West Africa

Agricultural burning is widespread in Africa with fires breaking out in different regions at various times of the year. On January 28, 2014, when the Moderate Resolution Imaging Spectroradiometer (MODIS) on NASA’s Aqua satellite acquired this image, the Sahel region in West Africa was in the midst of its burning season. Fires are marked with red boxes and smoke hangs over the scene.
NASA image courtesy LANCE/EOSDIS MODIS Rapid Response Team at NASA GSFC. Caption by Holli Riebeek.
Instrument: 
Aqua - MODIS - NASA

Mossel Bay Webcam Image: 31 January 2014 05h50 SAST

MOSSEL BAY WEBCAM: YACHT AND BOAT CLUB

This Webcam shows the view from the Mossel Bay Yacht and Boat Club in northerly direction, starting with Santos Beach on the left side, followed by Dias Beach, Hartenbos and Little Brak River with the Outeniqua Mountains in the background. The photo will automatically be updated after two minutes.

The camera is a MOBOTIX M24M Secure with a 90 degrees wide angle lens and a resolution of 3 Megapixel.

- Avenues Guest House  

1 – 3 Day Weather Forecast Summary: Southern Cape/Garden Route Area - Weather-Forecast.com

Mossel Bay 1 – 3 Day Weather Forecast Summary:  Mostly dry. Warm (max 31°C on Sat morning, min 19°C on Sun night). Wind will be generally light.
  
George 1 – 3 Day Weather Forecast Summary:  Mostly dry. Warm (max 31°C on Sat morning, min 19°C on Sun night). Wind will be generally light.
  
Knysna 1 – 3 Day Weather Forecast Summary:  Mostly dry. Warm (max 31°C on Sat morning, min 20°C on Sun night). Winds decreasing (fresh winds from the ESE on Fri afternoon, light winds from the SSW by Sat morning).
 
Plettenberg Bay 1 – 3 Day Weather Forecast Summary:  Mostly dry. Warm (max 31°C on Sat morning, min 20°C on Sun night). Winds decreasing (fresh winds from the ESE on Fri afternoon, light winds from the SSW by Sat morning).

Oudtshoorn 1 – 3 Day Weather Forecast Summary:  Mostly dry. Warm (max 32°C on Sat afternoon, min 19°C on Sun night). Wind will be generally light.
 
Riversdale 1 – 3 Day Weather Forecast Summary:  Some drizzle, heaviest during Sat night. Warm (max 31°C on Sat morning, min 20°C on Sat night). Wind will be generally light.
 
- WeatherForecast.com

SA National Severe Weather Warnings: 31 January 2014 04h00 SAST - SAWS

Image: SAWS (Click on image for larger view.)

Weather Satellite Image: 31 January 2014 05H00 SAST

Image: Eumetsat (Click on image for larger view.)

Latest Sea Level Synoptic Chart for SA : 30 January 2014 18:00z

Image: SAWS (Click on image for larger view.)

Possible 24 Hour Rainfall: Southern Cape + Garden Route Areas - 1stweather.com

Image: 1stweather.com (Click on image for larger view.)

Thursday 30 January 2014

Mossel Bay Rainfall Data: Period: 29 - 30 January 2014 08h00 - 08h00 SAST

  1mm of light rainfall recorded at Heiderand, Mossel Bay for the above period.

Final Update : Medium to heavy rain forecast for parts of the Southern Cape Area (28 - 30 January 2014)

1mm of light rain fell overnight in Heiderand, Mossel Bay bringing the total for the above period to 13mm's. The system also brought heavy rain to parts of the Eastern Cape before moving  easterly into the South Indian Ocean.  Although nothing dramatically has happened in the Southern Cape we need to keep an eye on the formation of cut-off low systems which normally result into heavy rain and flooding that can ran into millions of rands of damage.

Rainfall figures for parts of the Southern Cape (Period: 08h00 - 08h00 28 - 29 January 2014):

Mossel Bay - 12mm
Oudtshoorn -  22mm
Beaufort West - 5mm
George - 12mm
Knysna - 7mm
Ladismith (WC) - 13mm
Laingsburg - 5mm
Plettenberg Bay - 2mm

- MSBWX


Mount Etna Gears Up

On January 22, 2014, Mount Etna was gearing up for another burst of activity. A diffuse plume of gas and ash rose from the Northeast Crater at the volcano’s summit, accompanied by a smaller, dense plume emitted from the New Southeast Crater. Within a few days, lava would flow down the slopes of the Valle del Bove. Etna, located on the Italian island of Sicily, is Europe’s most active volcano.
This false-color image combines near infrared, red, and green light. Snow is white, geologically fresh (up to 100 years old) lava is black and dark brown, while vegetation is deep red. The volcanic plume is light gray. The image was collected by the Advanced Spaceborne Thermal Emission and Reflection Radiometer (ASTER) on NASA’s Terra satellite.
  1. References

  2. Behncke, Boris (2014, January 23) Trying so hard. Accessed January 28, 2014.
  3. INGV Sezione di Catania Osservatorio Etneo (2014, January 23) Etna Update. Accessed January 28, 2014.
NASA Earth Observatory image by Jesse Allen and Robert Simmon, using data from the NASA/GSFC/METI/ERSDAC/JAROS, and U.S./Japan ASTER Science Team.
Instrument: 
Terra - ASTER - NASA

Bushfires in Victoria, Australia

Two large bushfires burned in Victoria, Australia, on January 28, 2014, when the Moderate Resolution Imaging Spectroradiometer (MODIS) on NASA’s Aqua satellite acquired this image. The fires are marked in red. The larger of the two fires appears to be the Club Terrace fire, which the Victorian government reports has burned 5,567 hectares. The other fire is most likely the 1,884-hectare Yalmy fire in Snowy River National Park, but could be any of a number of other fires burning nearby.
February is usually the high point of the fire season in Victoria. With a heatwave in the forecast, the state has brought in additional firefighters to prepare for extreme fire danger.
  1. References

  2. Country Fire Authority (2014, January 29) Fireys arrive in Victoria. Accessed January 29, 2014.
  3. VicEmergency (2014, January 29) Incidents and warnings. Accessed January 29, 2014.
NASA image courtesy LANCE/EOSDIS MODIS Rapid Response Team at NASA GSFC. Caption by Holli Riebeek.
Instrument: 
Aqua - MODIS - NASA

George Airport Webcam: 30 January 2014 06h36 SAST

GEORGE AIRPORT WEBCAM - Outeniqua Mountain Cam - AviationWeatherSA

1 – 3 Day Weather Forecast Summary: Southern Cape/Garden Route Area - Weather-Forecast.com

Mossel Bay 1 – 3 Day Weather Forecast Summary:  Mostly dry. Warm (max 31°C on Sat morning, min 20°C on Thu morning). Wind will be generally light.
  
George 1 – 3 Day Weather Forecast Summary:  Mostly dry. Warm (max 31°C on Sat morning, min 20°C on Thu morning). Wind will be generally light.
 
Knysna 1 – 3 Day Weather Forecast Summary:  Mostly dry. Warm (max 31°C on Sat morning, min 21°C on Thu morning). Winds increasing (calm on Thu morning, fresh winds from the ESE by Fri afternoon).
 
Plettenberg Bay 1 – 3 Day Weather Forecast Summary:  Mostly dry. Warm (max 31°C on Sat morning, min 21°C on Thu morning). Winds increasing (calm on Thu morning, fresh winds from the ESE by Fri afternoon).

Oudtshoorn 1 – 3 Day Weather Forecast Summary:  Mostly dry. Warm (max 34°C on Sat afternoon, min 19°C on Thu morning). Wind will be generally light.
 
Riversdale 1 – 3 Day Weather Forecast Summary:  Mostly dry. Warm (max 32°C on Sat morning, min 20°C on Sat night). Wind will be generally light.
 
- WeatherForecast.com

SA National Severe Weather Warnings: 30 January 2014 04h00 SAST - SAWS

Image: SAWS (Click on image for larger view.)

Weather Satellite Image: 30 January 2014 06H00 SAST

Image: Eumetsat (Click on image for larger view.)

Latest Sea Level Synoptic Chart for SA : 29 January 2014 18:00z

Image: SAWS (Click on image for larger view.)

Possible 24 Hour Rainfall: Southern Cape + Garden Route Areas - 1stweather.com

Image: 1stweather.com (Click on image for larger view.)

Wednesday 29 January 2014

Update 3: Medium to heavy rain forecast for parts of the Southern Cape Area (28 - 30 January 2014)

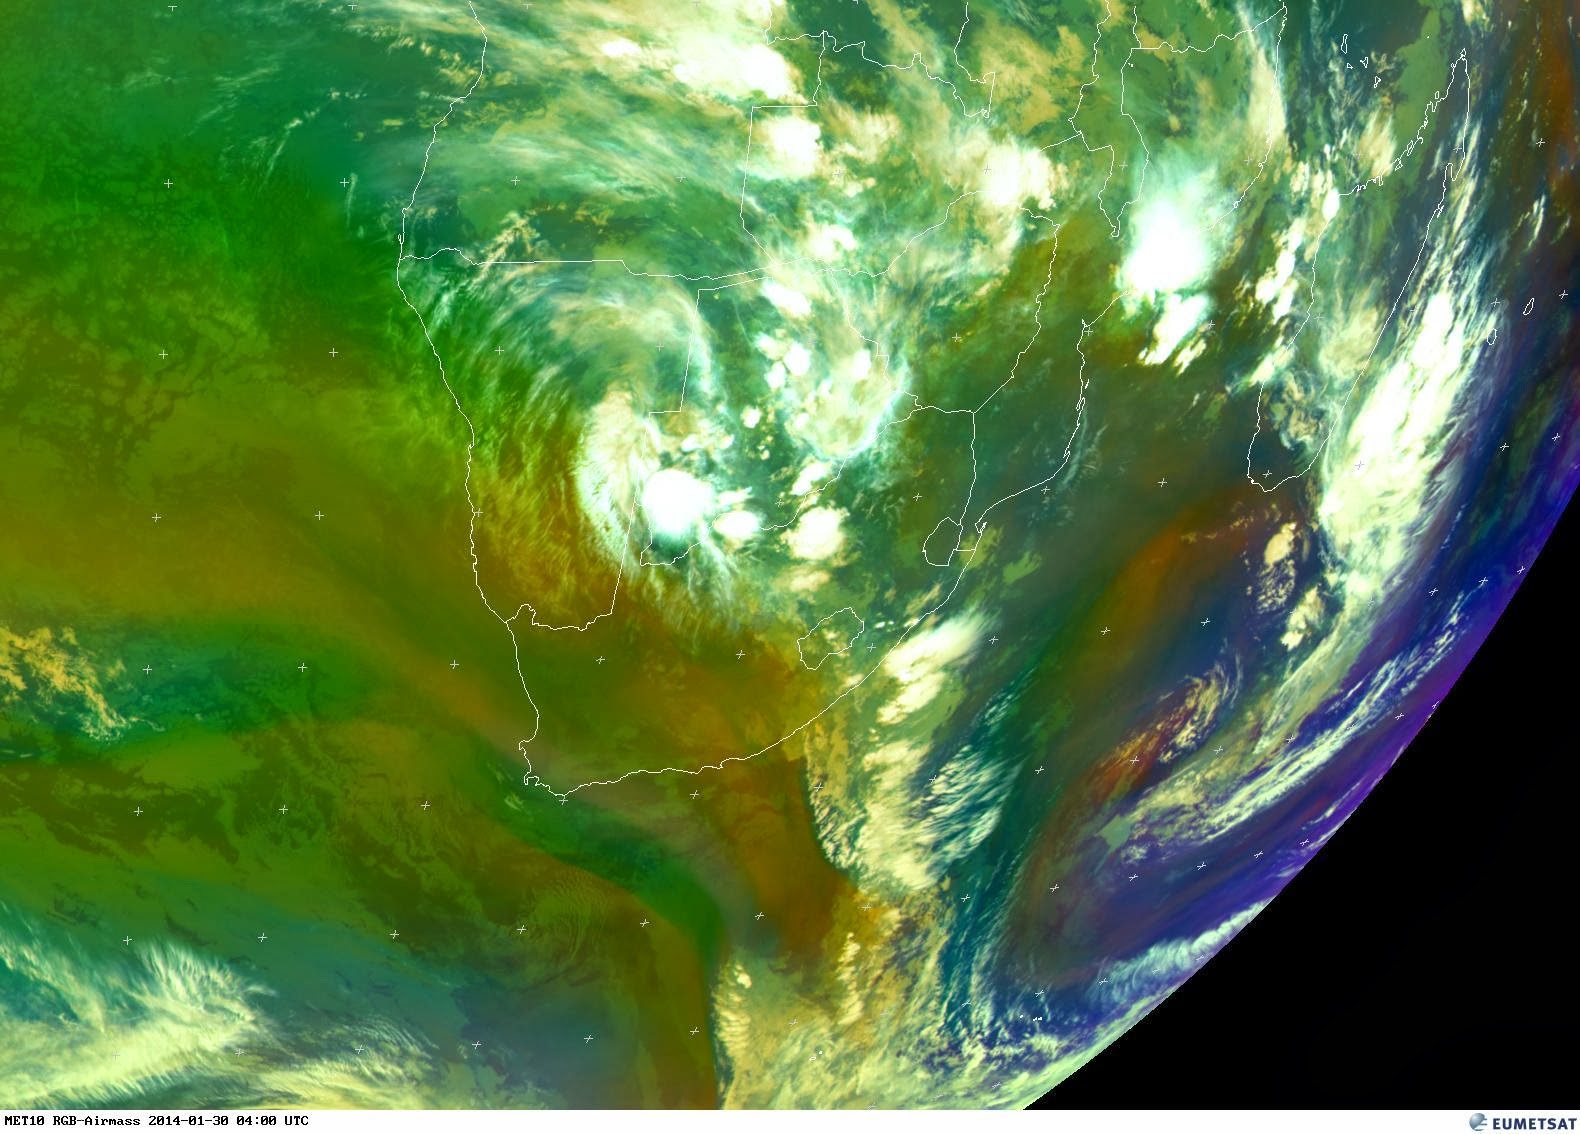
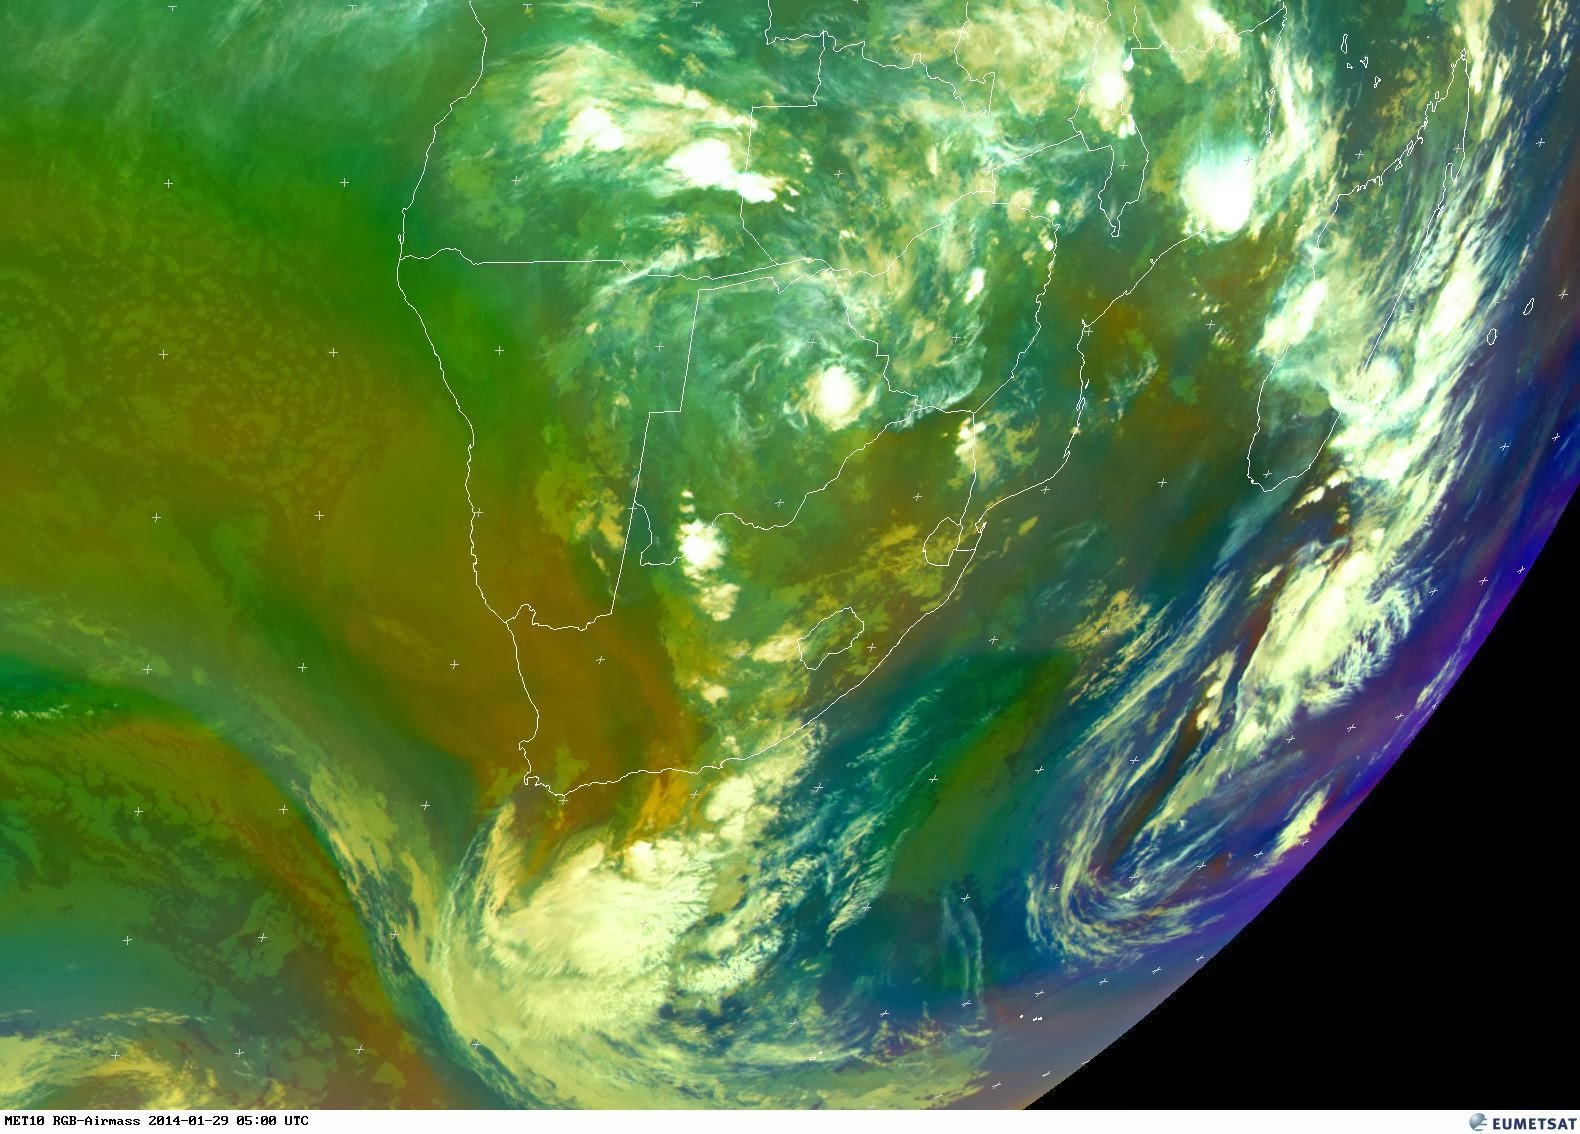
12mm of rain was measured in Heiderand,  Mossel Bay.  This rain fell in the early hours of the morning and brought some relief to the hot weather we experienced the past few days.  This morning satellite image reflect that the upper air trough moved eastwards and is now situated over the Eastern Cape,  Free State and North West.  A large bank of clouds is also situated offshore to the south of the country but it would appear at this stage that this bank of clouds is moving eastwards away from the main land.


The latest prediction charts indicate that there is a possibility of light rain in parts of the drought stricken area of the Northwest Province.  Let's hope that this area of the country receive much needed widespread rain in the next few days.


I am still keeping an eye on the current system.  Although no cut-off low developed one should keep and eye on the weather as such systems in the past showed that mother nature and especially the weather has a will of its own.

- MSBWX

Mossel Bay Rainfall Data: Period: 28 - 29 January 2014 08h00 - 08h00 SAST

  12mm of medium rainfall recorded at Heiderand, Mossel Bay for the above period.

Western Sahara Desert, Mauritania

This photograph of cloud bands over southern Mauritania was taken from the International Space Station with an oblique angle such that the cloud shadows are a prominent part of the view. Beneath the clouds, the plateau of dark sedimentary rocks appears as a ragged, near-vertical escarpment (image top right). Isolated remnants of the plateau appear as dark mesas (flat-topped hills) across the top and near the center of the image. The escarpment is about 250 meters high, with a field of orange-colored dunes at the base (image upper right).

Prevailing winds in this part of the Sahara Desert blow from the northeast. (Note that north is to the right.) The wavy dunes are aligned transverse (roughly right angles) to these winds. The sand that makes the dunes is blown in from a zone immediately upwind (just out of the bottom of the image), where dry river beds and dry lakes provide large quantities of mobile sand. This pattern is typical in the western Sahara Desert, where plateau surfaces are mostly dune free and dune fields are located in the surrounding lowlands. Larger rivers deposit sandy sediment on the few occasions when they flow, sometimes only once in decades.

Astronaut photograph ISS038-E-26862 was acquired on January 8, 2014, with a Nikon D3S digital camera using a 180 millimeter lens, and is provided by the ISS Crew Earth Observations experiment and Image Science & Analysis Laboratory, Johnson Space Center. The image was taken by the Expedition 38 crew. It has been cropped and enhanced to improve contrast, and lens artifacts have been removed. 

The International Space Station Program supports the laboratory as part of the ISS National Lab to help astronauts take pictures of Earth that will be of the greatest value to scientists and the public, and to make those images freely available on the Internet. Additional images taken by astronauts and cosmonauts can be viewed at the NASA/JSC Gateway to Astronaut Photography of Earth. Caption by M. Justin Wilkinson, Jacobs at NASA-JSC.
Instrument: 
ISS - Digital Camera - NASA

Oudtshoorn Webcam Image: 29 January 2014 07h32 SAST

OUDTSHOORN CANGO CAVES WEBCAM
Oudtshoorn webcam refreshes every 30 min, situated at the northern edge of town facing the Swartberg Mountains - Oudtshoorn Website

1 – 3 Day Weather Forecast Summary: Southern Cape/Garden Route Area - Weather-Forecast.com

Mossel Bay 1 – 3 Day Weather Forecast Summary:   Mostly dry. Warm (max 25°C on Wed morning, min 20°C on Wed night). Wind will be generally light.
 
George 1 – 3 Day Weather Forecast Summary:  Mostly dry. Warm (max 25°C on Wed morning, min 20°C on Wed night). Wind will be generally light.
 
Knysna 1 – 3 Day Weather Forecast Summary:  Light rain (total 2mm), mostly falling on Wed morning. Warm (max 26°C on Fri afternoon, min 21°C on Wed night). Winds increasing (calm on Wed night, fresh winds from the ESE by Fri afternoon).
 
Plettenberg Bay 1 – 3 Day Weather Forecast Summary:  Light rain (total 2mm), mostly falling on Wed morning. Warm (max 26°C on Fri afternoon, min 21°C on Wed night). Winds increasing (calm on Wed night, fresh winds from the ESE by Fri afternoon).

Oudtshoorn 1 – 3 Day Weather Forecast Summary:  Mostly dry. Warm (max 29°C on Fri afternoon, min 20°C on Wed night). Wind will be generally light.
 
Riversdale 1 – 3 Day Weather Forecast Summary:  Mostly dry. Warm (max 28°C on Fri afternoon, min 20°C on Wed night). Wind will be generally light.
 
- WeatherForecast.com

SA National Severe Weather Warnings: 29 January 2014 04h00 SAST - SAWS

Image: SAWS (Click on image for larger view.)

Weather Satellite Image: 29 January 2014 06H00 SAST

Image: Eumetsat (Click on image for larger view.)

Latest Sea Level Synoptic Chart for SA : 29 January 2014 00:00z

Image: SAWS (Click on image for larger view.)

Possible 24 Hour Rainfall: Southern Cape + Garden Route Areas - 1stweather.com

Image: 1stweather.com (Click on image for larger view.)

Tuesday 28 January 2014

Update 2: Meduim to heavy rain forecast for parts of the Southern Cape Area (28 - 30 January 2014)

The weather changed rapidly in the last few hours. It started to rain steadily at around 20h15 SAST in Heiderand, Mossel Bay. The latest satellite images reflect the upper air trough clearly which is now situated over parts of the Western and Northern Cape.  We need to keep a close watch on the current further development of the system.  It would appear that this system might develop into a cut-off low.  This is not clearly defined at the moment but should become clearer as and if the system develop further.  Quiet noticeably is the fact that this system looks the same in structure as the systems that brought heavy rain and flooding in November 2007 and 2008 to the Southern Cape and Overberg areas.  The difference is the lack of sufficient moisture at this stage.  That goes without saying that this could change if a cut-off low develops. 


Images: SAT24 + Wunderground (Click on images for larger view.)

Update 1: Meduim to heavy rain forecast for parts of the Southern Cape Area (28 - 30 January 2014)

Current forecast models still indicate the possibility of medium to heavy rain (10 - 25mm) for parts of the Southern Cape from the 28 - 30 January 2014. An upper trough is expected to move in over the Southern Cape accompanied by tropical moist air from Namibia.  There is also the possibility of instability which could result in thunderstorms in parts of the Western- , Southern Cape and Karoo.  The upper air trough can clearly be seen on this mornings satellite images.


The following image reflect the possible rainfall for the period as indicated in the chart.


Images: NCEP (Click on images for larger view.)


Haze in the Sichuan Basin

A layer of haze filled China’s Sichuan Basin on January 23, 2014, when the Moderate Resolution Imaging Spectroradiometer (MODIS) on NASA’s Terra satellite acquired this natural-color image. The haze obscured many features usually visible in satellite images of the area, including Sichuan province’s largest city, Chengdu. In the eastern part of the basin the tops of a series of ridges were visible above the layer of pollution. Skies were clear in the highlands west of the basin, while tendrils of pollution snaked into valleys northeast and southeast of it.
On the day this image was acquired, measurements from ground-based sensors at the U.S. Consulate in Chengdu reported PM2.5 measurements of 267 micrograms per cubic meter of air. Fine, airborne particulate matter (PM) that is smaller than 2.5 microns (about one thirtieth the width of a human hair) is considered dangerous because it is small enough to enter the passages of the human lungs. Most PM2.5 aerosol particles come from the burning of fossil fuels and biomass (wood fires and agricultural burning). The World Health Organization considers PM2.5 to be safe when it is below 25.
Haze in this region tends to worsen in the winter, when cold, heavy air traps pollutants near the surface. In this case, the haze was likely trapped in the Sichuan Basin by a temperature inversion. Normally, air is warmest near the surface of the Earth. Occasionally, a mass of warm air will move over cooler air so that the atmosphere actually warms with altitude. Since the cool air does not have the energy to rise through the warm air, vertical circulation slows and air becomes trapped near the surface.
Any pollutant that enters the air gets trapped as well, and haze builds up over time. Temperature inversions often form in basins and valleys because surrounding higher-elevation land helps contain cold air. Daily images of the Sichuan Basin show that that the pollution has persisted for several days.
  1. References

  2. Air quality in China (2014, January 24) Chengdu Air Pollution: Real-time Air Quality Index (AQI). Accessed January 24, 2014.
  3. Goddard Earth Sciences Data and Information Center (2014, January 24) Sichuan Basin. Accessed January 24, 2014.
  4. U.S. Department of State (2014, January 24) U.S Consulate Air Quality Monitor. Accessed January 24, 2014.
NASA image courtesy Jeff Schmaltz, LANCE MODIS Rapid Response. Caption by Adam Voiland.
Instrument: 
Terra - MODIS - NASA

When is the next supermoon?

According to the definition of supermoon coined by an astrologer, Richard Nolle, over 30 years ago – and popularized only in the past few years – the year 2014 has a total of five supermoons. They are the two new moons of January, and the full moons of July, August and September. January 1, 2014 was the year’s first supermoon, and January 30 will be the second. We’ve heard people call this second new moon a Black Moon, but that name doesn’t come from astronomy either. Still, like any supermoon, the January 30 supermoon will have an effect on Earth’s oceans. Expect large tides. We won’t have a single calendar month with two supermoons again until January 2018. Follow the links below to learn more about the supermoons of 2014, about what makes a moon a supermoon, and more.

What is a supermoon? We confess: before a few years ago, we in astronomy had never heard that term. To the best of our knowledge, the term supermoon was coined by the astrologer Richard Nolle over 30 years ago. The term is only now coming into popular usage. Nolle has defined a supermoon as:
… a new or full moon which occurs with the moon at or near (within 90% of) its closest approach to Earth in a given orbit.
That’s a pretty generous definition and allows for many supermoons. The first supermoon, for 2014, came on New Year’s Day, with the January 1 new moon, and the second is on January 30. By this definition, according to Nolle:
There are 4-6 supermoons a year on average.
How many supermoons in 2014? By Nolle’s definition, the new moon or full moon has to come within 361,863 kilometers (224,851 miles) of our planet, as measured from the centers of the moon and Earth, in order to be considered a supermoon.

Therefore, the year 2014 gives us a total of five supermoons: two January new moons, and the full moons of July, August and September.

The full moon on August 10, 2014, will present the closest supermoon of the year (356,896 kilometers or 221,765 miles).

However, the new moons on January 1 and January 30 are not far behind, featuring the year’s second-closest and third-closest supermoons, respectively. On January 1, the moon turned new less than 10 hours before reaching lunar perigee – the moon’s closest point to Earth in its orbit. On January 30, the moon will turn new nearly 12 hours after reaching lunar perigee.

Want more detail? Okay. In 2014, the moon comes closest to Earth on August 10 (356,896 kilometers), and swings farthest away some two weeks before, on July 28 (406,567 kilometers). That’s a difference of 49,671 kilometers (406,567 – 356,896 = 49,671). Ninety percent of this 49,671-figure equals 44,703.9 kilometers (0.9 x 49,671 = 44,703.9). Presumably, any new or full moon coming closer than 361,863.1 kilometers (406,567 – 44,703.9 = 361,863.1) would be “at or near (within 90% of) its closest approach to Earth.”

Assuming I figured everything correctly, that gives us our 5 supermoons of 2014: two new moon supermoons (January 1 and 30) and three full moon supermoons (July 12, August 10 and September 9).
However, the perigee full moon on August 10 will give us the most “super” supermoon of them all!

Photographs or other instruments can tell the difference between a supermoon and ordinary full moon. The supermoon of March 19, 2011 (right), compared to an average moon of December 20, 2010 (left). Image by Marco Langbroek of the Netherlands via Wikimedia Commons.

What is a Black Moon? We had never heard the term Black Moon until recently. It doesn’t come from astronomy, or skylore. Instead, according to David Harper, the term comes from Wiccan culture. It’s the name for the second of two new moons in a month. Does a Black Moon have to be a supermoon in order to be called Black? No. You can read more about Black Moons here.

Sten Odenwald at astronomycafe.net lists some other names for the second new moon in a month: Spinner Moon, Finder’s Moon, Secret Moon.


Around each new moon (left) and full moon (right) – when the sun, Earth, and moon are located more or less on a line in space – the range between high and low tides is greatest. These are called spring tides. A supermoon – new or full moon at its closest to Earth – accentuates these tides. Image via physicalgeography.net

Spring tides accompany January 2014′s supermoons. Will the tides be larger than usual at the January 1 and 30 new moons? Yes, all new moons (and full moons) combine with the sun to create larger-than-usual tides, but perigee new moons (or perigee full moons) elevate the tides even more.

Each month, on the day of the new moon, the Earth, moon and sun are aligned, with the moon in between. This line-up creates wide-ranging tides, known as spring tides. High spring tides climb up especially high, and on the same day low tides plunge especially low.

The January 1 and 30 extra-close new moons will accentuate the spring tide, giving rise to what’s called a perigean spring tide. If you live along an ocean coastline, watch for high tides caused by the two January 2014 new moons – or supermoons.

Will these high tides cause flooding? Probably not, unless a strong weather system accompanies the perigean spring tide. Still, keep an eye on the weather, because storms do have a large potential to accentuate perigean spring tides.

What did astronomers call these moons before we called them supermoons? We called them a perigee full moon, or a perigee new moon. Perigee just means “near Earth.”
The moon is full, or opposite Earth from the sun, once each month. It’s new, or more or less between the Earth and sun, once each month. And, every month, as the moon orbits Earth, it comes closest to Earth. That point is called perigee. The moon always swings farthest away once each month; that point is called apogee. No doubt about it. Supermoon is a catchier term than perigee new moon or perigee full moon.

We first became familiar with the supermoon label in the year 2011 when the media used supermoon to describe the full moon of March 19, 2011. On that date, the full moon aligned with proxigee – the closest perigee of the year – to stage the closest, largest full moon of 2011.

Closest full supermoons in the year’s ahead More often than not, the one day of the year that the full moon and perigee align also brings about the year’s closest perigee (also called proxigee). Because the moon has recurring cycles, we can count on the full moon and perigee to come in concert in periods of about one year, one month and 18 days.
Therefore, the full moon and perigee realign in periods of about one year and 48 days. So we can figure the dates of the closest full moons in recent and future years as:
March 19, 2011
May 6, 2012
June 23, 2013
August 10, 2014
September 28, 2015
November 14, 2016
January 2, 2018.
There won’t be a perigee full moon in 2017 because the full moon and perigee won’t realign again (after November 14, 2016) until January 2, 2018.
By the way, some astronomers will call all the full moons listed above proxigee full moons.
But, like you, we’ll have fun just calling ‘em supermoons.

Bottom line: The term supermoon doesn’t come from astronomy. It’s comes from astrology, and the definition is pretty generous so that there are 4 to 6 supermoons each year. This post explains what a supermoon is, how many will occur in 2014, which moon is the most “super” of all the 2014 supermoons, and gives a list of upcoming full supermoons for the years ahead. The first supermoon of 2014 is on January 1. The second is on January 30. We’re hearing people call that second new moon in a month a Black Moon, but that name doesn’t come from astronomy, either. The January 30 new supermoon can be expected to raise the height of the tides slightly.

- EarthSky

George Webcam (Garden Route): 28 January 2014 06h51 SAST

GEORGE AIRPORT WEBCAM - Outeniqua Mountain Cam

1 – 3 Day Weather Forecast Summary: Southern Cape/Garden Route Area - Weather-Forecast.com

Mossel Bay 1 – 3 Day Weather Forecast Summary:  Heavy rain (total 20mm), heaviest during Tue night. Warm (max 26°C on Tue morning, min 20°C on Wed night). Wind will be generally light.
 
George 1 – 3 Day Weather Forecast Summary:  Heavy rain (total 20mm), heaviest during Tue night. Warm (max 26°C on Tue morning, min 20°C on Wed night). Wind will be generally light.
 
Knysna 1 – 3 Day Weather Forecast Summary:  Moderate rain (total 14mm), heaviest on Wed morning. Warm (max 26°C on Tue morning, min 21°C on Wed night). Wind will be generally light.
 
Plettenberg Bay 1 – 3 Day Weather Forecast Summary:   Moderate rain (total 14mm), heaviest on Wed morning. Warm (max 26°C on Tue morning, min 21°C on Wed night). Wind will be generally light.
 
Oudtshoorn 1 – 3 Day Weather Forecast Summary:  Heavy rain (total 26mm), heaviest during Tue night. Warm (max 32°C on Tue afternoon, min 20°C on Wed night). Wind will be generally light.
 
Riversdale 1 – 3 Day Weather Forecast Summary:  Moderate rain (total 18mm), heaviest on Tue night. Warm (max 29°C on Tue afternoon, min 20°C on Thu night). Wind will be generally light.
 
- WeatherForecast.com

SA National Severe Weather Warnings: 28 January 2014 04h00 SAST - SAWS

Image: SAWS (Click on image for larger view.)

Weather Satellite Images: 28 January 2014 06H00 + 05h30 SAST


Images: Eumetsat + SAT24 (Click on images for larger view.)

Latest Sea Level Synoptic Chart for SA : 28 January 2014 00:00z

Image: SAWS (Click on image for larger view.)

Possible 24 Hour Rainfall: Southern Cape + Garden Route Areas - 1stweather.com

(Click on image for larger view.)

Monday 27 January 2014

Strong 6.1 earthquake on island in western Greece

A strong earthquake has struck near the town of Lixourion, or Lixouri – population 9,800 – on the island of Kefalonia in western Greece. Reports of the magnitude of the quake vary, but, at this time, the U.S. Geological Survey (USGS) is still reporting the quake as a magnitude 6.1. The local time was late Sunday afternoon, January 26, 2014. Apparently the shaking was also felt in other countries, including Albania, Montenegro, Bulgaria and southern Italy. Seismologists and local officials are reporting damage and possible injuries, according to at least one report. Few details are available at this time. According to GreekReporter.com:

Residents of Kefalonia are scared. This event reminded them about the great earthquake of 1953 (M 7.2), where hundreds of people lost their lives.

Details of the quake, from USGS, follow

Event Time
2014-01-26 13:55:43 UTC
2014-01-26 15:55:43 UTC+02:00 at epicenter

Location
38.208°N 20.425°E depth=18.8km (11.7mi)

Nearby Cities
0km (0mi) NW of Lixourion, Greece
61km (38mi) NW of Zakynthos, Greece
87km (54mi) SSW of Preveza, Greece
89km (55mi) WSW of Mesolongi, Greece
289km (180mi) W of Athens, Greece

Bottom line: The USGS is reporting a strong earthquake in western Greece, on the island of Kefalonia, with the epicenter at the town of Lixourion on January 26, 2014.

- EarthSky

What is a Blood Moon?

View larger. | Hunter’s Moon collage from EarthSky Facebook friend Kausor Khan in Hyberabad, India. Notice that she choose reddish moons to depict the Hunter’s Moon. That’s because many people see the Hunter’s Moon low in the sky, and moons seen low in the sky appear reddish. In 2013, the Hunter’s Moon – sometimes called the Blood Moon – came in mid-October.

We have been receiving a number of inquiries about some upcoming Blood Moons in the years 2014 and 2015. And we want to say, first of all, that the Blood Moons most people are asking about are not part of astronomy. Instead, their origin is religious, at least according to Christian pastor John Hagee, who wrote a 2013 book about Blood Moons.  Still, since they’re moons, and since people are asking us, we wanted to reply.

Follow the links below to learn more about Blood Moons.

Blood Moons in astronomy
Dates of Harvest and Hunter’s Moons in 2014 and 2015
Blood Moons in Biblical prophecy
Dates of Biblical prophecy Blood Moons in 2014 and 2015
How common is a tetrad of total lunar eclipses?
Why is the term Blood Moon being used to mean a full moon of a lunar tetrad?

- EarthSky