Tuesday, 31 March 2015

Global Lightning Activity

Where does lightning flash most frequently? According to satellite observations, it occurs more often over land than over the oceans. And lightning seems to happen more often closer to the equator.

The map above shows the average yearly counts of lightning flashes per square kilometer from 1995 to 2013. Areas with the fewest number of flashes each year are gray and purple; areas with the largest number of lightning flashes—as many as 150 per year per square kilometer—are bright pink.

The map is based on data collected from 1998–2013 by the Lightning Imaging Sensor (LIS) on NASA’s Tropical Rainfall Measuring Mission satellite, and from 1995–2000 by the Optical Transient Detector (OTD) on the OrbView-1/Microlab satellite. Flashes above 38 degrees North were observed by OTD only, as the satellite flew to higher latitudes.

The higher frequency of lighting over land makes sense because solid earth absorbs sunlight and heats up faster than water; this means there is stronger convection and greater atmospheric instability, leading to the formation of thunder and lightning producing storms.

According to NASA’s Daniel Cecil, a member of the Global Hydrology and Climate Center’s lightning team, the data also have revealed some interesting regional trends. For example, scientists have observed a large number of flashes during the month of May in the Brahmaputra Valley of far eastern India. The heating and weather patterns are unstable and changeable at that time—just before the onset of the monsoon, which brings plenty of rain but much less lightning. In contrast, locations in Central Africa and Northwestern South America have large amounts of lightning throughout the entire year.

As the map shows, the highest amounts of lightning flashes occur in the far eastern Democratic Republic of Congo, and Lake Maracaibo in northwestern Venezuela.

Cecil noted that more years of data has not necessarily brought notable big-picture differences when compared to the earlier maps. “The longer record allows us to more confidently identify some of these finer details,” he said. “We can examine seasonality, and variability through the day and year-to-year.”
NASA Earth Observatory image by Joshua Stevens using LIS/OTD data from the Global Hydrology and Climate Center Lightning Team. Caption by Kathryn Hansen.
Instrument(s): 
TRMM - LIS

#Weather and #Disaster #Observations Western Cape : 31 March 2015 04h00 SAST - MSBWXB

SEVERE WEATHER ALERTS:
 
WARNINGS: Extremely high fire danger conditions are expected over eastern part of the Central Karoo District of the Western Cape.

WATCHES:------Nil

SPECIAL WEATHER ADVISORIES:Hot and humid weather will result i n extremely uncomfortable conditions in the Nelson Mandela Bay and Kouga local municipalities of Eastern Cape.


MOSSEL BAY REAL TIME WEATHER OBSERVATION:  

06h30 -  Clear skies. No Wind.  24 Deg/C. Going to be rather hot today.  Is this the last hot day before the cold weather sets in?   A change in weather normally occurs during Easter weekend. This is normally the time that cold fronts become more prominent.  I noticed that there is a cold front on its way.  More info as this front approaches the country from the west.

WEATHER FORECAST: WESTERN CAPE:

Cool to warm along the west and south - west coasts with morning fog patches, otherwise fine and hot but very hot in places over the interior. The wind along the coast will be light northerly to north - easterly along the south coast at first, otherwise moderate southwesterly to westerly. The expected UVB sunburn index:Very High


DISASTER OBSERVATION: WESTERN CAPE:

Nil

For real live updates follow @MSBWXB on Twitter. 

- MSBWXB + SAWS

1 – 3 Day #WeatherForecast Summary: #SouthernCape / #GardenRoute Area - Weather-Forecast

Mossel Bay 1 – 3 Day Weather Forecast Summary:  Mostly dry. Warm (max 32°C on Tue afternoon, min 16°C on Thu night). Wind will be generally light.
 
George 1 – 3 Day Weather Forecast Summary: Mostly dry. Warm (max 32°C on Tue afternoon, min 16°C on Thu night). Wind will be generally light.

Knysna 1 – 3 Day Weather Forecast Summary:  Mostly dry. Warm (max 29°C on Tue afternoon, min 17°C on Thu night). Wind will be generally light.

Plettenberg Bay 1 – 3 Day Weather Forecast Summary: Mostly dry. Warm (max 29°C on Tue afternoon, min 17°C on Thu night). Wind will be generally light.

Oudtshoorn 1 – 3 Day Weather Forecast Summary:  Mostly dry. Warm (max 32°C on Tue afternoon, min 17°C on Thu night). Wind will be generally light.

Riversdale 1 – 3 Day Weather Forecast Summary: Mostly dry. Warm (max 35°C on Tue afternoon, min 16°C on Thu night). Wind will be generally light.

 Issued: 1 am 31 Mar local time

- WeatherForecast.com

#WeatherSatellite Image South Africa: 31 March 2015 05h00 SAST -Eumetsat

Image: Eumetsat (Click on image for larger view.)

Latest Sea Level #SynopticChart South Africa: 30 March 2015 18H00 - SAWS

Image: SAWS (Click on image for larger view.)

Possible 24 Hour #Rainfall #Prediction South Africa - 1stweather

Image: 1stweather (Click on image for larger view.)

Monday, 30 March 2015

Lake Chad and a Bodele Dust Plume

This east-looking photograph, taken by astronauts from the International Space Station, shows the arid landscapes of the Sahara and the darker vegetation of the wetter, semi-arid woodland known as the Sahel.

The dark green marshes of Lake Chad stand out in the foreground. Even though it is more than 200 kilometers (120 miles) long, modern Lake Chad is just a small remnant of a vast lake that has repeatedly occupied the most of this landscape in the recent geological past. This lake basin stretches almost 1000 kilometers (600 miles) from the foreground of the image to the foot of the Tibesti Mountains. The lowest slopes of the Tibesti show the remnants of great deltas.
The image also captures an active dust plume, though it is partly obscured by the “Canada Arm” of the Space Station. The dust rises from the white mud flats of the ancient lake bed, likely from the Bodele Depression. Lofted into the atmosphere by northeasterly winds, dust from this basin often reaches the Atlantic Ocean, which is thousands of kilometers to the west. Occasionally this dust is even carried by weather systems as far as the Americas.

Astronaut photograph ISS042-E-244403 was acquired on February 12, 2015, with a Nikon D4 digital camera using a 32 millimeter lens, and is provided by the ISS Crew Earth Observations Facility and the Earth Science and Remote Sensing Unit, Johnson Space Center. The image was taken by a member of the Expedition 42 crew. The image has been cropped and enhanced to improve contrast, and lens artifacts have been removed. The International Space Station Program supports the laboratory as part of the ISS National Lab to help astronauts take pictures of Earth that will be of the greatest value to scientists and the public, and to make those images freely available on the Internet. Additional images taken by astronauts and cosmonauts can be viewed at the NASA/JSC Gateway to Astronaut Photography of Earth. Caption by M. Justin Wilkinson, Texas State University, Jacobs Contract at NASA-JSC.
Instrument(s): 
ISS - Digital Camera

#Weather and #Disaster #Observations Western Cape : 30 March 2015 04h00 SAST - MSBWXB

SEVERE WEATHER ALERTS:
 
WARNINGS: -----Nil

WATCHES:------Nil

SPECIAL WEATHER ADVISORIES:----Nil

MOSSEL BAY REAL TIME WEATHER OBSERVATION:  

07h00 -  8/8 cloud. No Wind.  20 Deg/C. 

WEATHER FORECAST: WESTERN CAPE:

Fog patches along the sout h coast, where it will be cool over the eastern parts, and west coast at first, otherwise partly cloudy and warm to hot, but fine in the south - west. The wind along the coast will be light northerly to north - easterly along the west coast at first, becoming light to moderate south - westerly, spreading to Cape Town by afternoon, otherwise moderate to fresh south - easterly to easterly. The expected UVB sunburn index:Very High


DISASTER OBSERVATION: WESTERN CAPE: Nil

For real live updates follow @MSBWXB on Twitter. 

- MSBWXB + SAWS

1 – 3 Day #WeatherForecast Summary: #SouthernCape / #GardenRoute Area - Weather-Forecast

Mossel Bay 1 – 3 Day Weather Forecast Summary:  Mostly dry. Warm (max 33°C on Tue afternoon, min 18°C on Mon morning). Wind will be generally light.
 
George 1 – 3 Day Weather Forecast Summary: Mostly dry. Warm (max 33°C on Tue afternoon, min 18°C on Mon morning). Wind will be generally light.

Knysna 1 – 3 Day Weather Forecast Summary:  Mostly dry. Warm (max 31°C on Tue afternoon, min 18°C on Wed night). Mainly fresh winds. 

Plettenberg Bay 1 – 3 Day Weather Forecast Summary: Mostly dry. Warm (max 31°C on Tue afternoon, min 18°C on Wed night). Mainly fresh winds.

Oudtshoorn 1 – 3 Day Weather Forecast Summary:  Mostly dry. Warm (max 33°C on Tue afternoon, min 18°C on Mon morning). Wind will be generally light.

Riversdale 1 – 3 Day Weather Forecast Summary: Mostly dry. Warm (max 34°C on Tue afternoon, min 18°C on Mon morning). Wind will be generally light.

 Issued: 1 am 30 Mar local time

- WeatherForecast.com

#WeatherSatellite Image South Africa: 30 March 2015 06h00 SAST -Eumetsat

Image: Eumetsat (Click on image for larger view.)

Latest Sea Level #SynopticChart South Africa: 30 March 2015 00H00 - SAWS

Image: SAWS (Click on image for larger view.)

Possible 24 Hour #Rainfall #Prediction South Africa - 1stweather

Image: 1stweather (Click on image for larger view.)

Sunday, 29 March 2015

Looking Down and Up at the Aurora

Even Earth’s skies were celebrating St. Patrick’s Day this year. On March 17, 2015, a severe geomagnetic storm—the strongest of the past decade—painted the sky with green, red, and blue auroras from New Zealand to Alaska. The storm conditions provided a fantastic opportunity for aurora viewing from above and below.

On Sunday, March 15, a coronal mass ejection exploded off the Sun towards Earth, as observed by NASA and National Oceanic and Atmospheric Administration (NOAA) instruments. By March 17, the burst of solar particles and energy reached Earth and kept the solar wind stream at potent levels for more than 24 hours. The storm reached a G4 or “severe” level on NOAA’s geomagnetic storm scale, and the Kp index—a metric for global geomagnetic storm activity—fluctuated between 6 to 8 on a scale that goes to 9. The “northern lights” reached as far south as the central and southern United States.
People first started reporting aurora sightings on Twitter from Colorado, Alaska, New Zealand and Australia. The storm’s peak intensity occurred during daylight hours in the Western Hemisphere, but aurora hunters in some regions still experienced a vibrant display at nightfall.

Using the “day-night band” (DNB) of the Visible Infrared Imaging Radiometer Suite (VIIRS), the Suomi NPP satellite acquired this view (above) of the aurora borealis around 1:30 a.m. Eastern Daylight Time on March 18, 2015. Auroras appear as white streaks over Hudson Bay, southern Canada, and the northern United States. The DNB sensor detects dim light signals such as auroras, airglow, gas flares, city lights, and reflected moonlight. In the image above, the sensor detected visible light emissions as energetic particles rained down from Earth’s magnetosphere into the gases of the upper atmosphere.

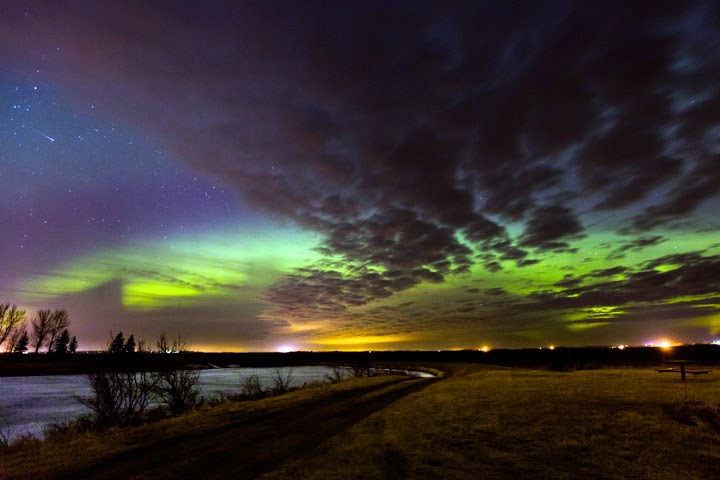
While Suomi NPP was observing from above, skywatchers on the ground captured some spectacular views (below). The first photo was taken by Chris Ratzlaff from Olds, Alberta, after sunset on March 17. The second was taken by Derick Wilson earlier that day (3 a.m. local time) in Paradox Valley, Colorado. The third image was captured by Janin Ober, who spotted the aurora on March 18 from Brandenburg, Germany.


The images were submitted through a project called Aurorasaurus, one of the first citizen science efforts focused on the northern lights. It is designed to improve a person’s chance of seeing the aurora by collecting and sharing observations reported via Twitter, the project’s website, and iOS and Android apps. For instance, Aurorasaurus has an algorithm that scrapes Twitter for aurora borealis and aurora australis reports. The project assembles those tweets and reports in real-time and places them on a map, along with information about cloud cover and the extent of the auroral oval—the region centered around each Pole where the aurora is estimated to be visible.

For the Saint Patrick’s Day storm, Aurorasaurus gathered 35,000 aurora-related tweets and reports, and users verified more than 250 of them as positive sightings. The project sent more 361 real-time notifications alerting users that an aurora might be visible near them.
The project intends to use the citizen science observations as “ground truth” for improving auroral oval models. The Aurorasaurus team consists of space weather scientists, information scientists, and education researchers at NASA, the New Mexico Consortium, Pennsylvania State University, and Science Education Solutions.
  1. References

  2. Miller, Steven D. et al (2012, September 25) Suomi satellite brings to light a unique frontier of nighttime environmental sensing capabilities. Proceedings of the National Academy of Sciences, Volume 109, Number 39, 15706–15711.
  3. National Geographic (2015, March 17) Solar Storm Could Dye Skies Green For St. Patrick’s Day. Accessed March 20, 2015.
  4. NASA (2002) Aurora: fabled glowing lights of the Sun-Earth Connection. (PDF) Accessed March 20, 2015.
  5. NASA Earth Observatory (2011, September 27) Fires in the Sky and On the Ground.
NASA Earth Observatory image by Jesse Allen, using VIIRS day-night band data from the Suomi National Polar-orbiting Partnership. Suomi NPP is the result of a partnership between NASA, the National Oceanic and Atmospheric Administration, and the Department of Defense. Caption by Kasha Patel and Adam Voiland.
Instrument(s): 
Suomi NPP - VIIRS

#Weather and #Disaster #Observations Western Cape : 29 March 2015 04h00 SAST - MSBWXB

SEVERE WEATHER ALERTS:
 
WARNINGS: -----Nil

WATCHES:------Nil

SPECIAL WEATHER ADVISORIES:----Nil


MOSSEL BAY REAL TIME WEATHER OBSERVATION:  

10h00 -  Clear skies. No Wind.  24 Deg/C.  Beautiful sunny day.

WEATHER FORECAST: WESTERN CAPE:

Partly cloudy along the south coast at fi rst otherwise fine and warm but hot in places over the interior. The wind along the coast will be moderate easterly along the south coast at first, otherwise fresh southeasterly, becoming strong along the west in the evening. The expected UVB sunburn index:Very High


DISASTER OBSERVATION: WESTERN CAPE:

Nil

For real live updates follow @MSBWXB on Twitter. 

- MSBWXB + SAWS

1 – 3 Day #WeatherForecast Summary: #SouthernCape / #GardenRoute Area - Weather-Forecast

Mossel Bay 1 – 3 Day Weather Forecast Summary:    Mostly dry. Warm (max 32°C on Tue afternoon, min 18°C on Sun night). Wind will be generally light.

George 1 – 3 Day Weather Forecast Summary: Mostly dry. Warm (max 32°C on Tue afternoon, min 18°C on Sun night). Wind will be generally light.

Knysna 1 – 3 Day Weather Forecast Summary:    Mostly dry. Warm (max 29°C on Tue afternoon, min 18°C on Sun night). Winds increasing (calm on Sun night, fresh winds from the W by Tue night).

Plettenberg Bay 1 – 3 Day Weather Forecast Summary: Mostly dry. Warm (max 29°C on Tue afternoon, min 18°C on Sun night). Winds increasing (calm on Sun night, fresh winds from the W by Tue night).

Oudtshoorn 1 – 3 Day Weather Forecast Summary:  Mostly dry. Warm (max 33°C on Tue afternoon, min 17°C on Sun night). Wind will be generally light.

Riversdale 1 – 3 Day Weather Forecast Summary: Mostly dry. Warm (max 35°C on Tue afternoon, min 17°C on Sun morning). Wind will be generally light.

 Issued: 1 am 29 Mar local time

- WeatherForecast.com

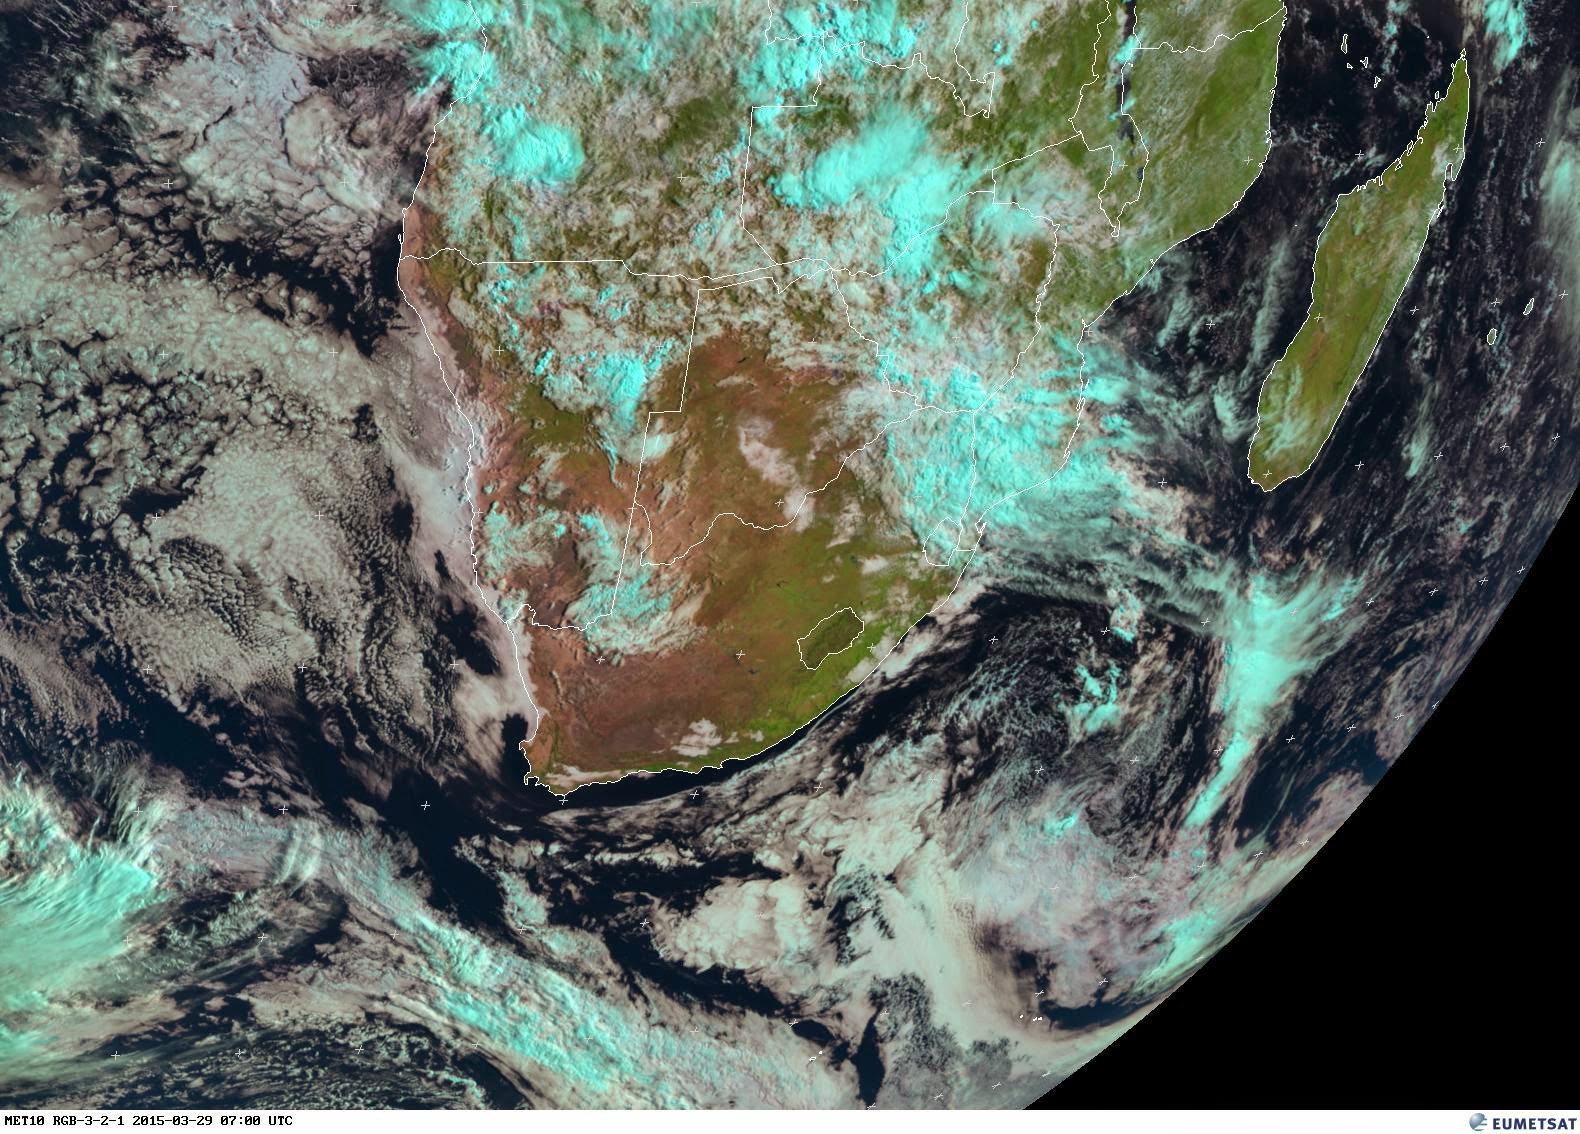
#WeatherSatellite Image South Africa: 29 March 2015 09h00 SAST -Eumetsat


Images: Eumetsat (Click on images for larger view.)

Latest Sea Level #SynopticChart South Africa: 29 March 2015 00H00 - SAWS

Image: SAWS (Click on image for larger view.)

Possible 24 Hour #Rainfall #Prediction South Africa - 1stweather

Image: 1stweather (Click on image for larger view.)

Saturday, 28 March 2015

“V” is for Volcano

On March 23, 2015, the Operational Land Imager (OLI) on Landsat 8 acquired this image of ashfall on the snow around Shiveluch—one of the largest and most active volcanoes on Russia’s Kamchatka Peninsula. Ash from volcanic eruptions can be swept in a narrow direction by the wind. When the wind changes direction so, too, does the location of the ashfall.
A subsequent image, acquired on March 26, 2015, by NASA’s Aqua satellite, shows winds shifting again, this time carrying the ash toward the south and southeast.
  1. References

  2. Jeff Schmaltz, LANCE MODIS Rapid Response Team (2015, March 26) Ash plume from Shiveluch, Kamchatka Peninsula. Accessed March 26, 2015.
  3. NASA Earth Observatory (2015, February 28) A Plume Advances Over Shiveluch. Accessed March 26, 2015.
  4. Smithsonian Institution Global Volcanism Program (2015, March) Sheveluch. Accessed March 26, 2015.
NASA Earth Observatory image by Jesse Allen, using Landsat data from the U.S. Geological Survey. Caption by Kathryn Hansen.
Instrument(s): 
Landsat 8 - OLI

#Weather and #Disaster #Observations Western Cape : 28 March 2015 04h00 SAST - MSBWXB

SEVERE WEATHER ALERTS:
 
WARNINGS: -----Nil

WATCHES:Heavy rain is possible in places in Limpopo Province and in Mpumalanga lowveld and escarpment.

SPECIAL WEATHER ADVISORIES:----Nil


MOSSEL BAY REAL TIME WEATHER OBSERVATION:  

07h00 -  Clear skies. No Wind.  19 Deg/C.  5 mm rain measured overnight at Heiderand, Mossel Bay.

WEATHER FORECAST: WESTERN CAPE:

Partly cloudy along the south coast at first otherwise fine and warm but hot in the west. The wind along the coast will be moderate south - easterly but moderate to fresh easterly to south easterly along the south coast. The expected UVB sunburn index: Very High


DISASTER OBSERVATION: WESTERN CAPE:
Nil

For real live updates follow @MSBWXB on Twitter. 

- MSBWXB + SAWS

1 – 3 Day #WeatherForecast Summary: #SouthernCape / #GardenRoute Area - Weather-Forecast

Mossel Bay 1 – 3 Day Weather Forecast Summary:  Mostly dry. Warm (max 23°C on Sun morning, min 17°C on Sat morning). Wind will be generally light.
 
George 1 – 3 Day Weather Forecast Summary: Mostly dry. Warm (max 23°C on Sun morning, min 17°C on Sat morning). Wind will be generally light.

Knysna 1 – 3 Day Weather Forecast Summary:    Mostly dry. Warm (max 23°C on Sun morning, min 17°C on Sat morning). Winds decreasing (fresh winds from the ESE on Sat afternoon, light winds from the ENE by Sat night).

Plettenberg Bay 1 – 3 Day Weather Forecast Summary: Mostly dry. Warm (max 23°C on Sun morning, min 17°C on Sat morning). Winds decreasing (fresh winds from the ESE on Sat afternoon, light winds from the ENE by Sat night).

Oudtshoorn 1 – 3 Day Weather Forecast Summary:  Mostly dry. Warm (max 28°C on Sun afternoon, min 17°C on Sat morning). Wind will be generally light.

Riversdale 1 – 3 Day Weather Forecast Summary: Mostly dry. Warm (max 27°C on Sat afternoon, min 15°C on Sat morning). Wind will be generally light.

 Issued: 1 am 28 Mar local time

- WeatherForecast.com

#WeatherSatellite Image South Africa: 28 March 2015 05h00 SAST -Eumetsat

Image: Eumetsat (Click on image for larger view.)

Latest Sea Level #SynopticChart South Africa: 27 March 2015 18H00 - SAWS

Image: SAWS (Click on image for larger view.)

Possible 24 Hour #Rainfall #Prediction South Africa - 1stweather

Image: 1stweather (Click on image for larger view.)

Friday, 27 March 2015

In the Aftermath of #Cyclone Pam


When category 5 cyclone Pam swept over the island nation of Vanuatu in March 2015, two of the hardest hit islands were Tanna and Erromango. While Erromango is home to just a few thousand people, about 30,000 people live on Tanna. On March 17, 2015,—three days after the storm hit the islands—the Operational Land Imager on Landsat 8 acquired imagery revealing the widespread effects of the storm.

Before Pam, Erromango appeared dark green due to the lush tropical vegetation that thrives on it. The cyclone’s fierce winds downed many trees, stripped vegetation, and coated leaves in damaging salt spray, leaving the islands with a browner hue in the aftermath. Before and after views of Tanna are available at the bottom of the page.

According to scientists from Tropical Storm Risk, Erromango likely faced the most severe winds. Their analysis of Pam’s wind field—based on data from the Joint Typhoon Warning Center and an analytical model of the atmosphere—suggested that Erromango saw gusts up to 320 kilometers (200 miles) per hour. With top gusts of 260 kilometers (160 miles) per hour, Tanna faired slightly better in the analysis. With Erromango’s vegetation appearing slightly browner and more disturbed than Tanna’s, this Landsat imagery supports that interpretation.

Pam took a heavy human toll. The storm killed six people and seriously injured many more, according to media reports. The homes of 80 percent of the residents of Tanna were either damaged or destroyed. Meanwhile, ongoing water and food shortages—and severe damage to the island’s only hospital—mean the humanitarian situation could worsen.


References
NASA Earth Observatory images by Joshua Stevens, using Landsat data from the U.S. Geological Survey. Caption by Adam Voiland.
Instrument(s): 
Landsat 8 - OLI

#Weather and #Disaster #Observations Western Cape : 27 March 2015 04h00 SAST - MSBWXB


SEVERE WEATHER ALERTS:
 
WARNINGS: -----Nil

WATCHES: -----Nil

SPECIAL WEATHER ADVISORIES:1. Hot and humid weather will result in extremely uncomfortable conditio n s over the Lowveld of Limpopo on Friday. 2. Heavy rain is expected in places in the L impopo Province and in the north eastern parts of Mpumalanga on Saturday and Sunday.

MOSSEL BAY REAL TIME WEATHER OBSERVATION:  

06h30 -  8/8 Cloud. No Wind.  19 Deg/C. Continues rain falling since early this morning. Most welcome rain. 10mm rain measured overnight at Heiderand, Mossel Bay.

WEATHER FORECAST: WESTERN CAPE:

Cloudy and cool with scattered showers and rain along the south coast and adjacent interior,otherwise partly cloudy and warm, becoming fine. The wind along the coast will be moderate westerly to south westerly along the south coast at first, otherwise moderate to fresh southerly to south easterly, becoming strong in the extreme south - west in the evening. The expected UVB sunburn index:Very Hig h


DISASTER OBSERVATION: WESTERN CAPE:

Nil

For real live updates follow @MSBWXB on Twitter. 

- MSBWXB + SAWS

1 – 3 Day #WeatherForecast Summary: #SouthernCape / #GardenRoute Area - Weather-Forecast

Mossel Bay 1 – 3 Day Weather Forecast Summary:  Light rain (total 8mm), mostly falling on Fri afternoon. Warm (max 23°C on Sun morning, min 16°C on Fri night). Wind will be generally light.
 
George 1 – 3 Day Weather Forecast Summary: Light rain (total 8mm), mostly falling on Fri afternoon. Warm (max 23°C on Sun morning, min 16°C on Fri night). Wind will be generally light.

Knysna 1 – 3 Day Weather Forecast Summary:  Light rain (total 6mm), mostly falling on Fri afternoon. Warm (max 23°C on Sun afternoon, min 17°C on Fri afternoon). Winds decreasing (fresh winds from the ESE on Sat afternoon, light winds from the E by Sun night).

Plettenberg Bay 1 – 3 Day Weather Forecast Summary: Light rain (total 6mm), mostly falling on Fri afternoon. Warm (max 23°C on Sun afternoon, min 17°C on Fri afternoon). Winds decreasing (fresh winds from the ESE on Sat afternoon, light winds from the E by Sun night).

Oudtshoorn 1 – 3 Day Weather Forecast Summary:  Some drizzle, heaviest during Fri afternoon. Warm (max 28°C on Sun afternoon, min 15°C on Fri night). Wind will be generally light.

Riversdale 1 – 3 Day Weather Forecast Summary: Light rain (total 6mm), mostly falling on Fri afternoon. Warm (max 27°C on Sun afternoon, min 15°C on Fri night). Wind will be generally light.

 Issued: 1 am 27 Mar local time

- WeatherForecast.com

#WeatherSatellite Image South Africa: 27 March 2015 06h00 SAST -Eumetsat

Image: Eumetsat (Click on image for larger view.)

Latest Sea Level #SynopticChart South Africa: 27 March 2015 00H00 - SAWS

Image: SAWS (Click on image for larger view.)

Possible 24 Hour #Rainfall #Prediction South Africa - 1stweather

Image: 1stweather (Click on image for larger view.)

Thursday, 26 March 2015

Bigger Thunderstorms are Bringing More Rain to the Tropics


A new study has shown that increasing rainfall in the wettest regions of the tropics is caused by an increase in large, well-organized thunderstorms. The joint research, based in part on NASA satellite data, was conducted by scientists from the Australian Research Council Centre of Excellence for Climate System Science (ARCCSS) and NASA and was published online in Nature on March 25, 2015.

Many scientists have thought that in a warming world some regions would see more rain because a warmer atmosphere can hold more water vapor. The idea seemed to be supported by recent observations showing strong precipitation increases in the wettest tropical regions—sometimes referred to as a “rich-get-richer” pattern.

The analysis by ARCCSS and NASA found that recent rainfall increases in places such as the western Pacific Ocean are actually due to large storms occurring more frequently, rather than individual storms producing more rain.

“The observations showed the increase in rainfall is directly caused by the change in the character of rain events in the tropics rather than a change in the total number of rain events,” said lead author Jackson Tan, who conducted this research while at Australia’s Monash University. He now works at NASA’s Wallops Flight Facility. “What we are seeing is more big and organized storms, and fewer small and disorganized rain events.”

The top map above shows the change in the rate of tropical rainfall between 1998 and 2009; the second map shows how much of that change is due to intense storms. Shades of green depict areas where the rate has increased, while shades of orange show areas where less rain has fallen. The maps are based on rainfall data from NASA’s Tropical Rainfall Measuring Mission (1998–2009) and the Global Precipitation Climatology Project (1983–2009). Those rainfall data were compared to cloud data from the International Satellite Cloud Climatology Project (1983 to 2009).

The study helps chip away at one of the big questions facing climate change science: To what degree will a warmer world accelerate the water cycle and patterns of rainfall and drought? Tan’s study revolves around what scientists call “organized deep convection”—in short, large thunderstorms. These storms make up about 5 percent of the weather systems in the tropics but are responsible for about 50 percent of tropical rainfall.

While this study does not delve into what is causing the increase in large storms, it does reveal a tight correlation between this trend and increasing rainfall. Analyzing rainfall and cloud data from 1983 to 2009, Tan found that large storms are still producing similar or even less amounts of rain on average, but they are happening more often.

“This work changes our perception of why tropical precipitation is increasing,” said co-author George Tselioudis, a researcher at the NASA Goddard Institute for Space Studies who also authored a 2010 paper that defined trends in organized deep convection in the tropics. “We thought it was because the warmer atmosphere holds more moisture and, therefore, when storms occur they rain more. But that doesn’t seem to be the case. Instead, the warmer tropical atmosphere becomes better organized to produce large storms more frequently.”

The new finding also raises an intriguing next question: Why are these weather systems organizing in the atmosphere more frequently? That’s not yet known, Tan and Tselioudis said, but the finding does point the way to a new line of research on the topic. Scientists have been focusing on the transfer of heat and moisture in the atmosphere—the thermodynamics of the system. Tselioudis said this finding should direct attention to the dynamics of the atmosphere—the fundamental physics of circulation.
NASA Earth Observatory images by Jesse Allen, based on data provided by Jackson Tan (NASA/GSFC). Caption by Patrick Lynch.
Instrument(s): 
Model
TRMM - MPA